

Education and Training in Data Science
Over the past few years, I have been actively involved in the training of human resources in the fields of Data Science and Bioinformatics, with a strong emphasis on bridging theory, practice, and real-world applications in data-driven research. This work has taken shape primarily through educational projects developed within the Data Science courses offered at Ilum School of Science (Brazilian Center for Research in Energy and Materials)

Espectroscolors
Data Visualization for Absorbance Analysis in Electronic Spectroscopy.
Github: https://github.com/Lorena881/PCD_Analise_Espectroscopia

Automation and Graphical Analysis of the Rayleigh Scattering Experiment
The code performs color measurements using a sensor connected to an Arduino to investigate the Rayleigh effect.
Github: https://github.com/JVictor1604/Automa-o-do-experimento-Rayleight/tree/main

AbsorGraph
This project aims to create a code that allows the user to input a data file containing Absorbance versus Wavelength values and receive a plot of their data, along with several optional analyses. These include Gaussian deconvolution, peak detection, and calculation of the area under the curve.

Kinematics Calculator
This project includes functions that perform calculations using kinematic and dynamic formulas, as well as generate plots related to these areas of physics. Due to the program's level of depth and accessibility, it is primarily intended for high school students.
Github: https://github.com/vitordreveck-ilum/PCD_Calculadora_Fisica

Data Rain
The program generates different types of graphs depending on the parameters analyzed, such as temperature, rainfall, solar radiation, relative humidity, and wind direction and intensity.'
Github: https://github.com/romulorcruz/Projeto_PCD_Climogramas
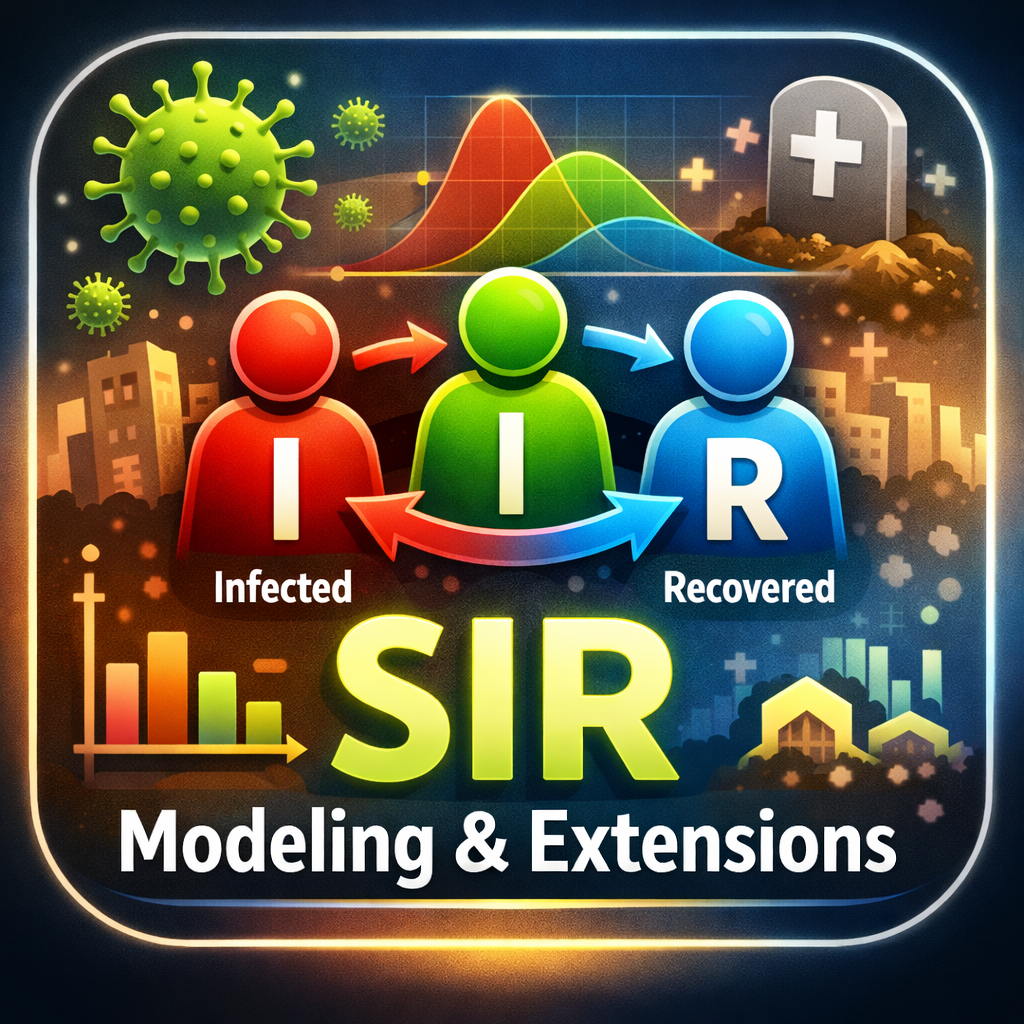
SIR Epidemiological Modeling and Extensions
This repository contained the source code and an interactive interface for our epidemiological modeling project, developed as a data science practice to explore infectious disease dynamics using SIR models and their extensions.
Plasmid Computer Decoder
The PCD (Plasmid Computer Decoder) project was developed as the final assignment for the Data Science Practice course by students from Ilum – School of Science. The tool receives a plasmid DNA or RNA sequence provided by the user or uploaded via a .txt or .FASTA file, enabling several analyses to be performed on the sequence.

No Stress ELISA
No Stress ELISA was developed as a tool to process and visualize data from ELISA plate readers, allowing users to upload spreadsheet data and automatically generate organized results and relevant plots through a simple web interface.
Github: https://github.com/PCD-ELISA/No-Stress_ELISA
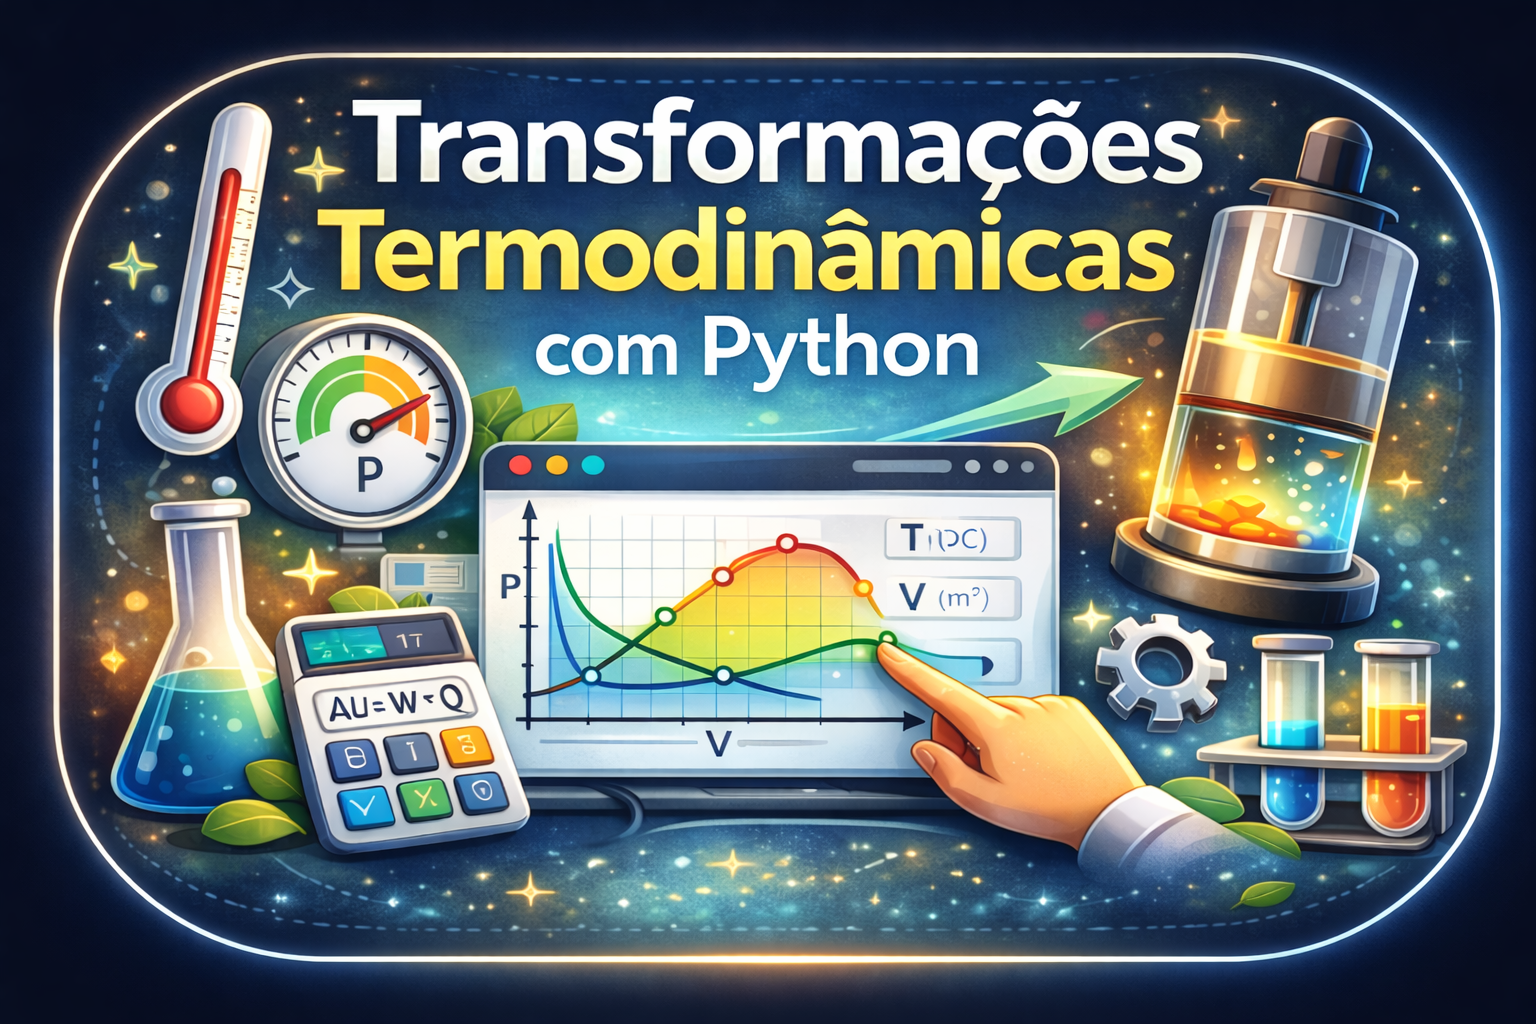
Thermodynamic Transformation Calculator for Ideal Gases
This project developed a Python-based calculator to analyze thermodynamic transformations in a monoatomic ideal gas, computing heat, work, internal energy, entropy changes, and cycle efficiency while generating P–V diagrams from user-provided pressure, volume, and temperature data.
Github: https://github.com/marip864/CTUP
Computing Viral Genetic Similarity
This project was developed for the Data Science Practice course during the first semester of 2025 in the Science and Technology program at Ilum – School of Science. The program applies Python tools such as matrices, string processing, and graphical visualization to compare similarities and differences among viral genomes, aiming to automate genomic analyses of arboviruses and support studies of their evolution, variants, and epidemiological dynamics.
Github: https://github.com/Luiza160/Projeto-PCD